
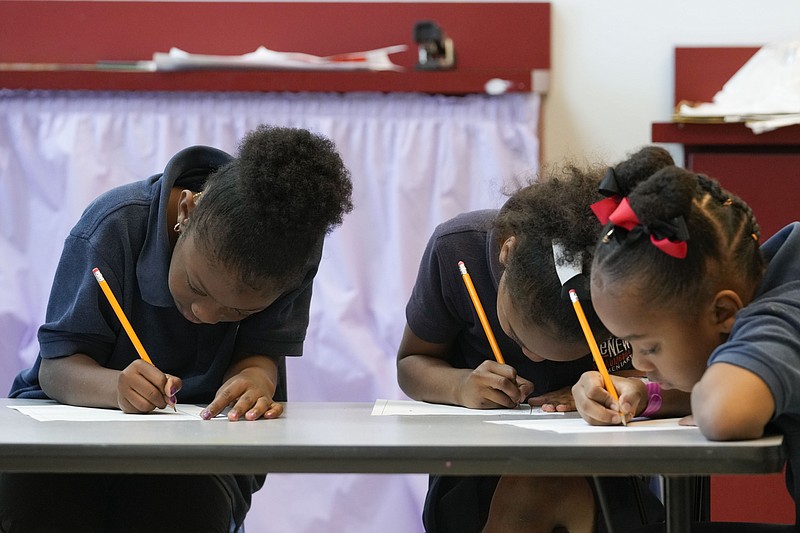
image via Arkansas Democrat-Gazette
I love a good data dive. Even more, I love a data dive with some complexity. But a spate of recent stories on the Mississippi literacy “miracle” has me torn. My inner data nerd is fascinated by the data puzzle, but my teacher heart hurts for all the kids caught up in the messy reality behind the numbers.
The backstory: In a mere 10 years, Mississippi went from almost the worst scores on the standardized national reading test (NAEP) for 4th graders in 2013 to narrowly exceeding the national average in the most recent test, administered in 2022. The raw NAEP figures showed Mississippi’s 4th graders just topping the national average overall and subgroups outscoring their national peers across categories, including race and income level and race and income level combined. This kind of achievement is virtually unheard of, so naturally Mississippi was quick to release their success to the media and the story was picked up by a number of local and national outlets, including the New York Times. Mississippi had cracked the problem of teaching kids to read!
BUT (you knew there was going to be a but), other outlets, including some very determined education bloggers, began really looking at the data and noticed some….issues.
There were red flags right off the bat, like the fact that although Mississippi Black students beat the national average for U.S. Black students in 2022, there is still a significant gap between White and Black students’ scores in Mississippi:
2022 NAEP Raw Scores:
White kids, Mississippi: 229.53
Black kids, Mississippi: 204.41
Lower-income black kids, Mississippi: 202.76
More concerning? That gap actually grew between 2013 and 2022 — increasing from 25% to 28% — and it affects a lot of kids. Forty-eight percent of the school-age children in Mississippi are Black, meaning almost half of all school children in the state are still far below their white peers by a year or more in NAEP terms. If Mississippi has cracked the reading problem, why is that gap so big? And why did it get even bigger?
Another red flag is the very muddy statistical picture created by something that happened in 2013, the year Mississippi implemented their aggressive program to address literacy rates in the the state and the year against which the impressive gains were measured. One part of this program was the Literacy Based Promotion Act (LBPA), which required that kids who failed to pass a reading test at the end of 3rd grade be held back. Mississippi calls this the “3rd Grade Gate.” Poor performers who are held back are given intensive reading instruction with additional supports to help bring them up to grade level.* But, the 3rd Grade Gate creates a host of confounders — additional factors that can also impact test results. For example, when students who are held back move forward with their new cohort and take the NAEP in 4th grade, they no longer statistically resemble other 4th graders nationally because they’re a full year older — actually 5th graders by age. Simple maturity can and does affect achievement** across a range of metrics. They also have another full year of instruction under their belts — 5 years instead of 4 — which can impact their test performance. These confounders make it very difficult to determine what, specifically, might be impacting improvement — age? intensive instruction? extra instruction? The NAEP is no longer just measuring 4th grade literacy in Mississippi or how well Mississippi’s reading program is doing at literacy because 9% of 4th graders got a completely different, more intensive reading program. And here’s another confounder: according to the Fordham Institute, as of 2019, Mississippi was holding back an average of 7.8% kids across every grade level leading up to that 3rd grade gate. That’s a whopping 31% of kids held back at least once K-3 — nearly a full third of kids who bring both extra age and extra instruction to that 4th grade standardized test. In fact, Mississippi retains more students across all grade levels than any other state in the U.S.. Retention levels alone are another big red flag.
The “3rd grade gate” also skews data in a specific way that isn’t immediately obvious to the casual observer but actually matters quite a lot. Because Mississippi removes poor-performing 3rd graders from the 4th grade cohort — an average of 9% of students — the 4th grade cohort immediately performs better on NAEP tests because the worst-performing students are no longer there. What I’m going to present to you below is one person’s read of this, but I want to say up front that I’m not sure the way he arrived at his conclusion is entirely copacetic. I think he’s correct about the immediate boost for 4th graders; it’s his later assertion I’m not sure about.
Kevin Drum asserts that the effect of removing the bottom 10% of readers from the cohort is actually huge:
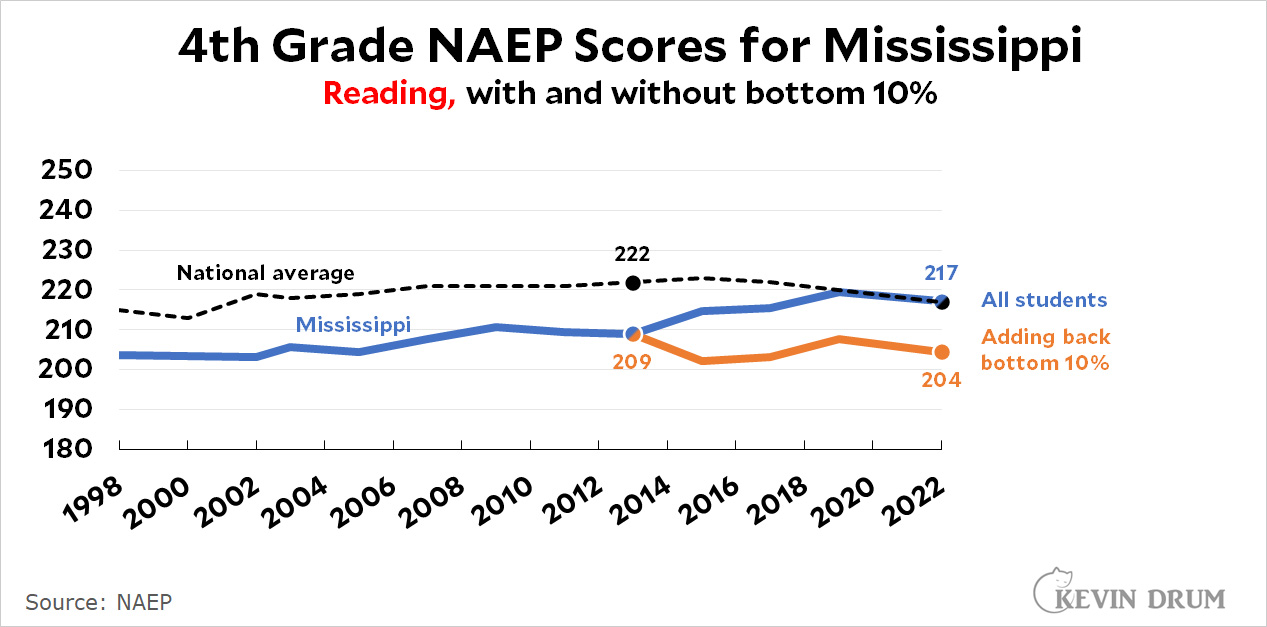
As Drum points out, in 2013 Mississippi was 13 points below the national average. After 2013 “all students” excludes all the kids who were held back. Now, here’s the part I think is a little hinky: He asserts that if the poorest performers are added back in, Mississippi’s scores in 2022 are still about 13 points below the national average. In his estimation, the 2013 reforms had virtually no effect. The problem with this is that I can’t tell where he’s getting the scores for that bottom 10% he’s adding back in. Simply adding in the bottom 10% from a previous year could be capturing completely different kids, so to me, that premise as a means of comparison seems highly flawed. However, the whole thing does raise some very intriguing IFs surrounding the “miracle.”***
One further piece of evidence may confirm Drum’s assessment: Whatever “gains” students have made, they have yet to show up in Mississippi’s 8th grade NAEP data. It’s possible we’re being a bit premature here; Mississippi first noted a big jump in 4th grade scores in 2019, so not until 2023 will the 8th grade NAEP scores show whether that cohort has been able to maintain their big leap forward as they move up the grades. Still, why haven’t the earlier cohorts — especially absent the drag factor of the worst readers — done better in 8th grade?
Perhaps everyone reporting the ‘miracle’ should have approached these findings with a healthy dose of skepticism. After all, Mississippi is not a state with a history of investing in poor children. As the L.A. Times cited, Mississippi has the highest rates of infant mortality in the U.S. and one of the highest rates for maternal death. It also has the highest child poverty rate in the U.S. at 27.7% (the national average is 16.9%). Its eligibility requirements for Medicare and nutrition assistance are so strict that many vulnerable people are left without access to basic medical care or food, including nearly a third of all children in the state.**** These requirements are so strict that a family of 3 does not qualify for Medicaid if their combined annual income is above $5,490. In 2022, Mississippi’s governor returned $130 million in federal funds that were earmarked for temporary rental assistance, calling it “a socialist experiment.”
When a state that is purposefully and doggedly removing any and all supports for children in poverty — including adequate access to food — suddenly arrives to the education party with what appears to be miraculous success, it should set all our Spidey-senses tingling. It’s highly improbable that a state can consistently fail its children in the most basic ways and somehow pull a rabbit out of a hat with literacy. In this case, Mississippi’s achievement appears to be more smoke and mirrors than miracle.
*I want to be very clear here that retention is a poor strategy with some serious negative consequences for children. Could we achieve improved scores without holding kids back? To find out, we’d need to give targeted, intensive instruction before the child fails the grade 3 test. In fact, why not make all reading instruction targeted and intensive? Why not identify issues well before grade 3 and address them intensively when gaps are smaller? And why not provide additional resources for those subgroups lagging behind their white peers before they reach the 3rd Grade Gate? It’s important to note that Black children in Mississippi are retained at much higher rates than other groups. In 2017-18, the last years for which we have data, 71% of all the 3rd graders retained in Mississippi schools were Black. That’s a staggering proportion; without question, retention in Mississippi disproportionately affects Black children.
***To really see the effect, you’d have to create multiple groups of poor readers; one group is held back and gets intensive instruction, one group gets intensive instruction but isn’t held back, and one group just moves along with their peers. Whether such a study is ethical is another issue.
****This percentage might actually be higher because 50% of all children in Mississippi are either in poverty or “low income,” meaning financially vulnerable. Mississippi’s requirements for receiving aid are so strict that this tier of children likely does not receive much (if anything) in the way of financial, medical, or nutritional assistance.